Python HPC Plot
Plot HPC comparision figure with Python.
Demo
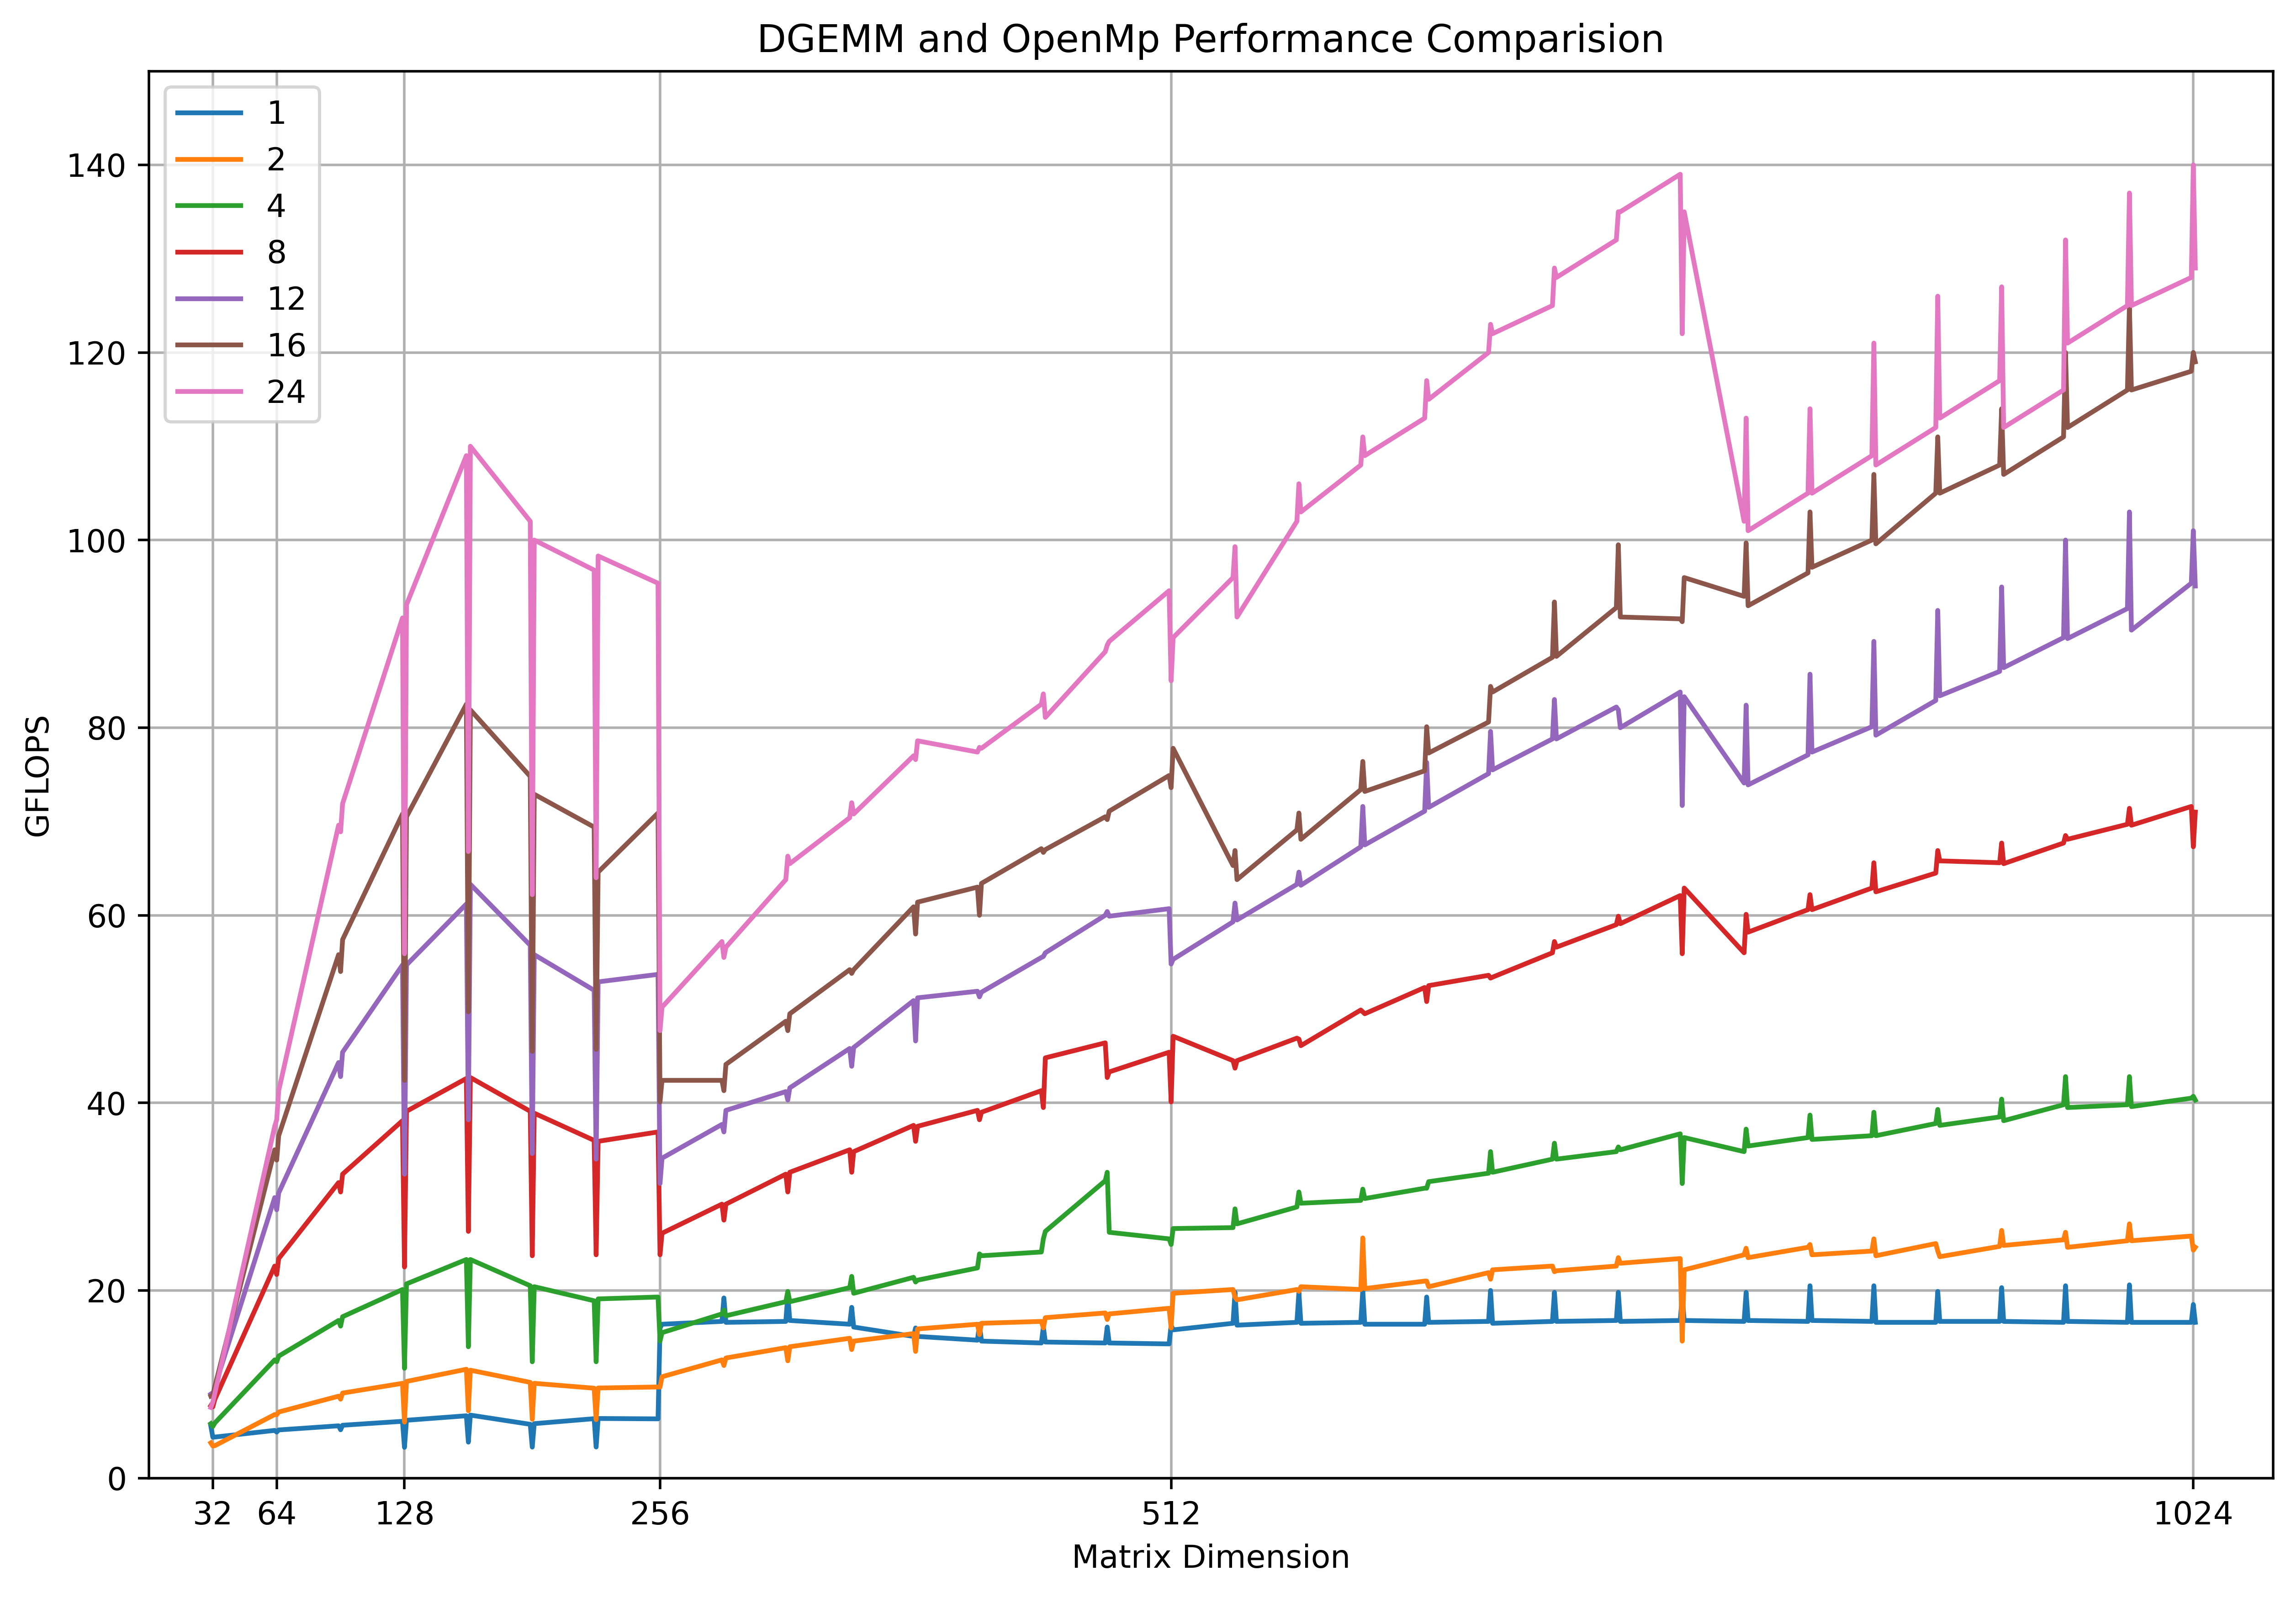
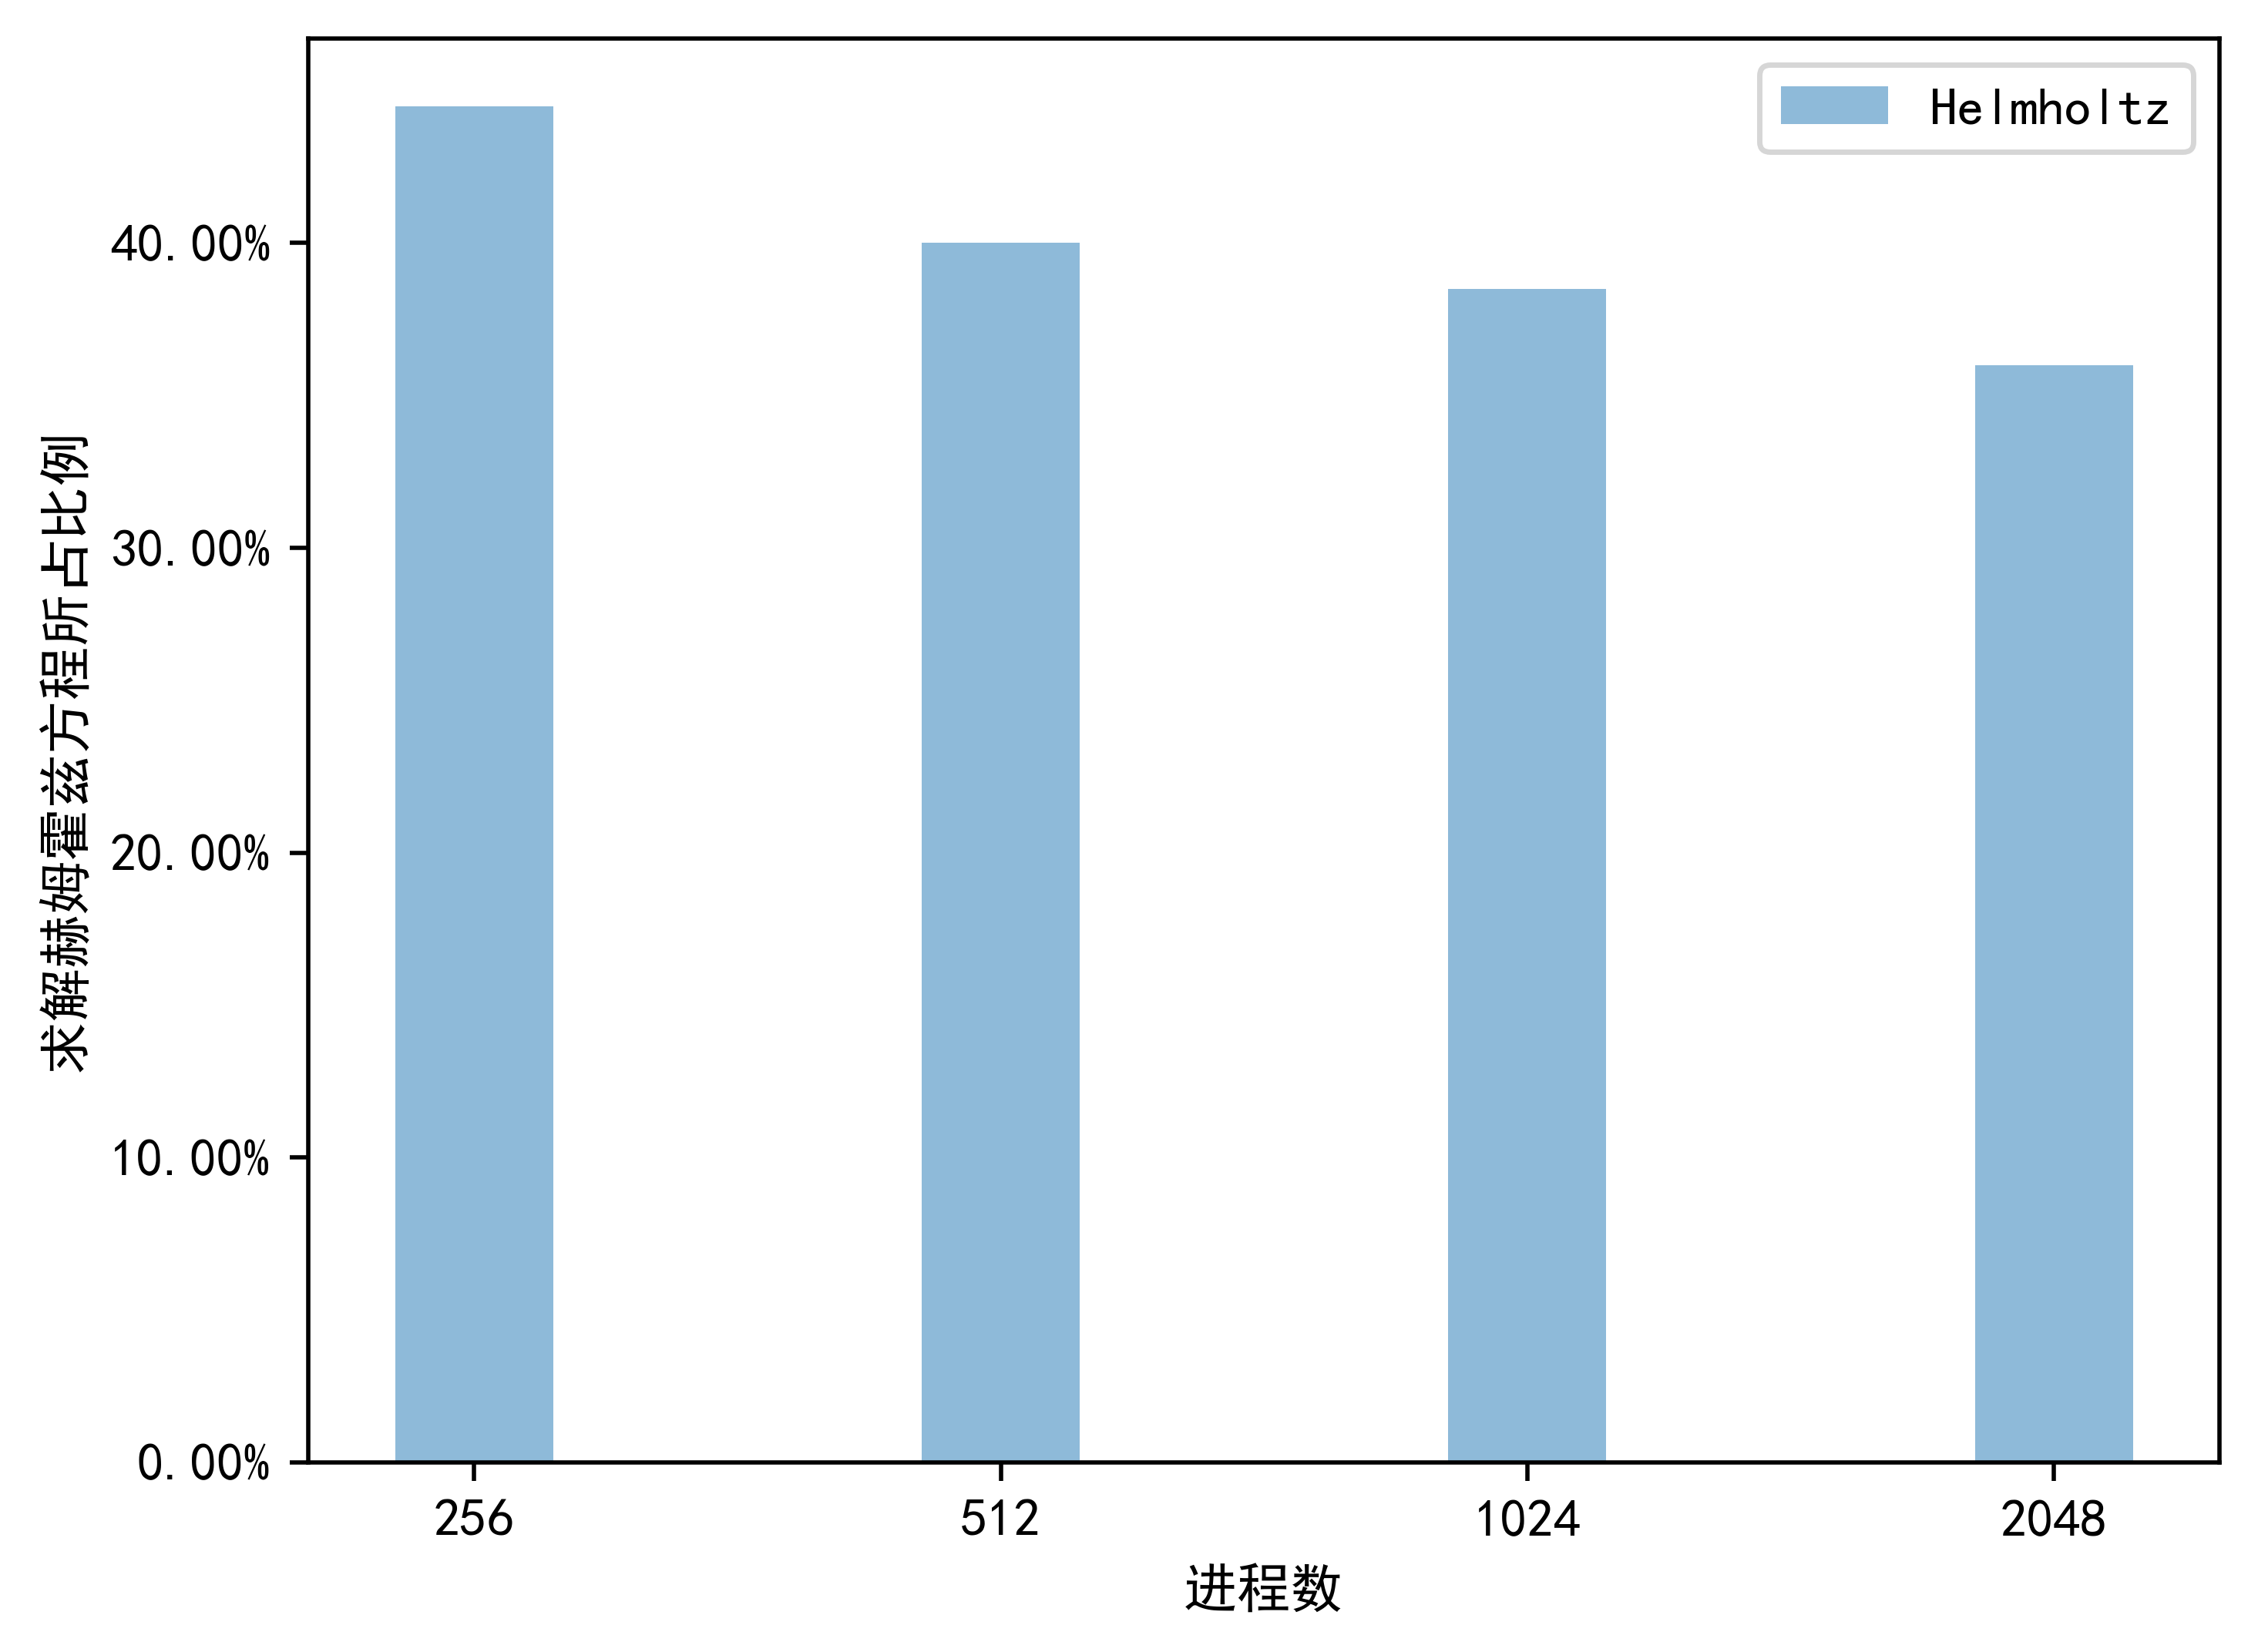
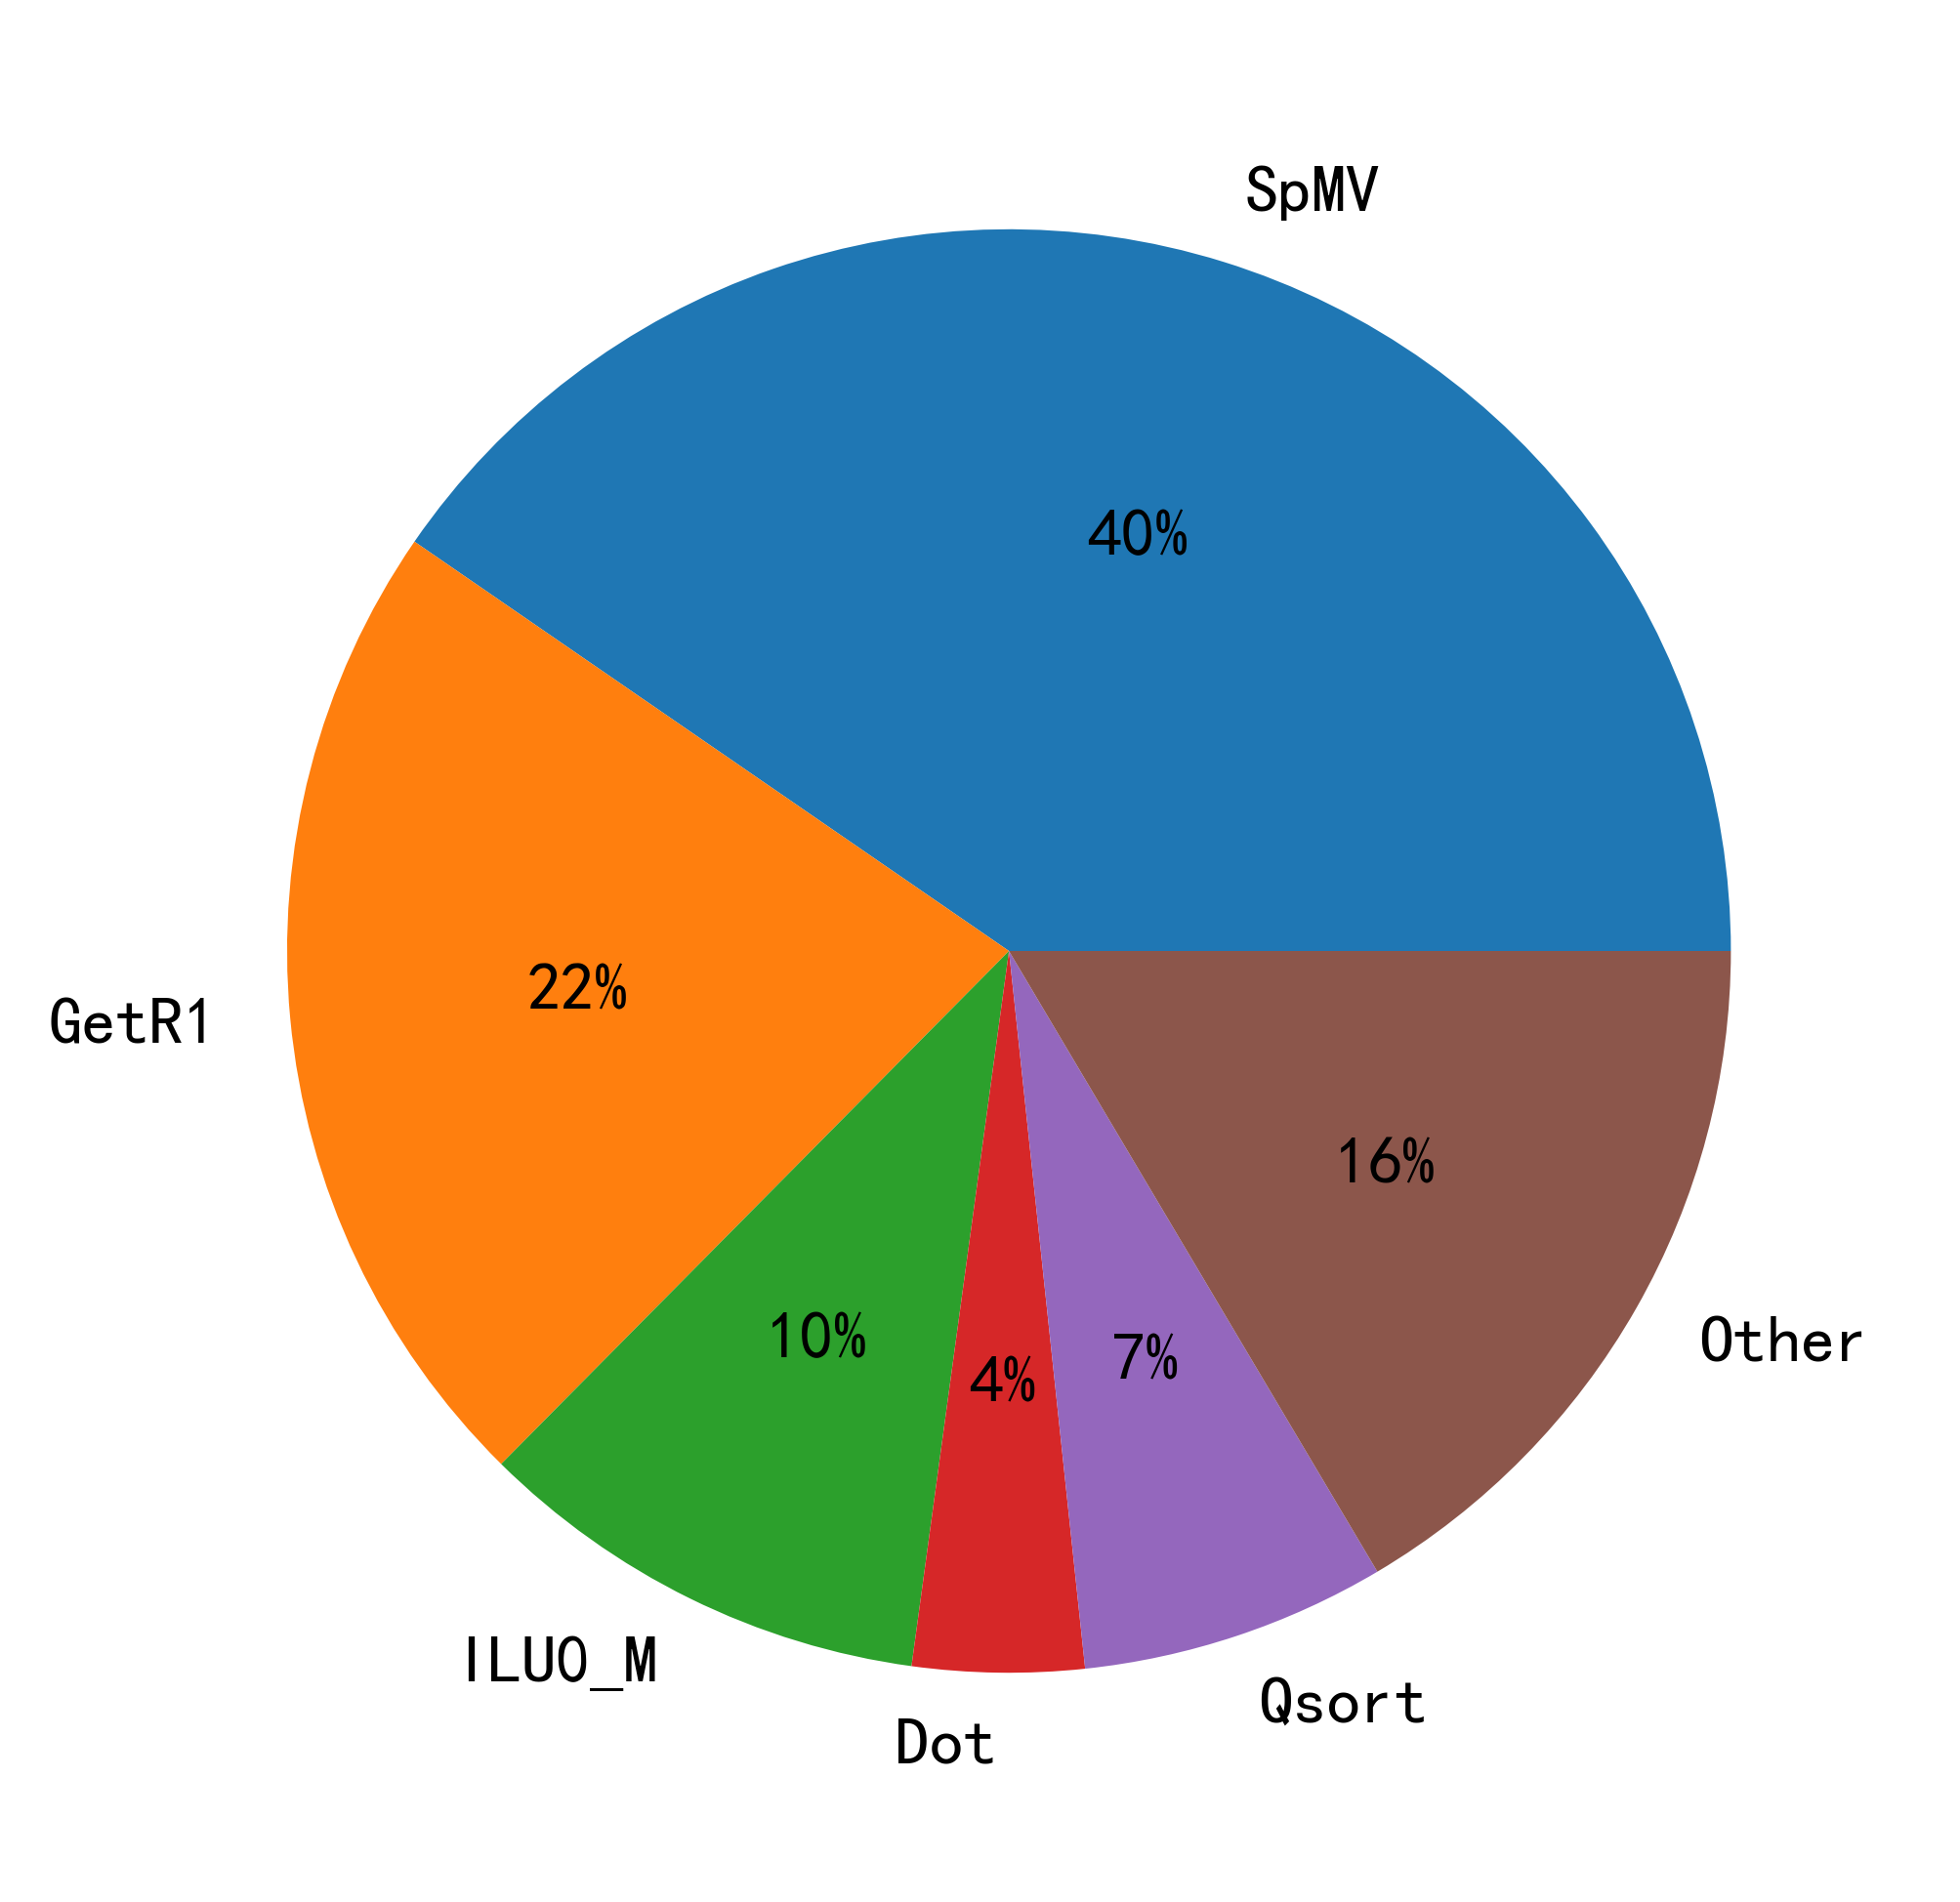
| Fig 1 | Fig 2 | Fig 3 | Fig 4 | Fig 5 |
|---|---|---|---|---|
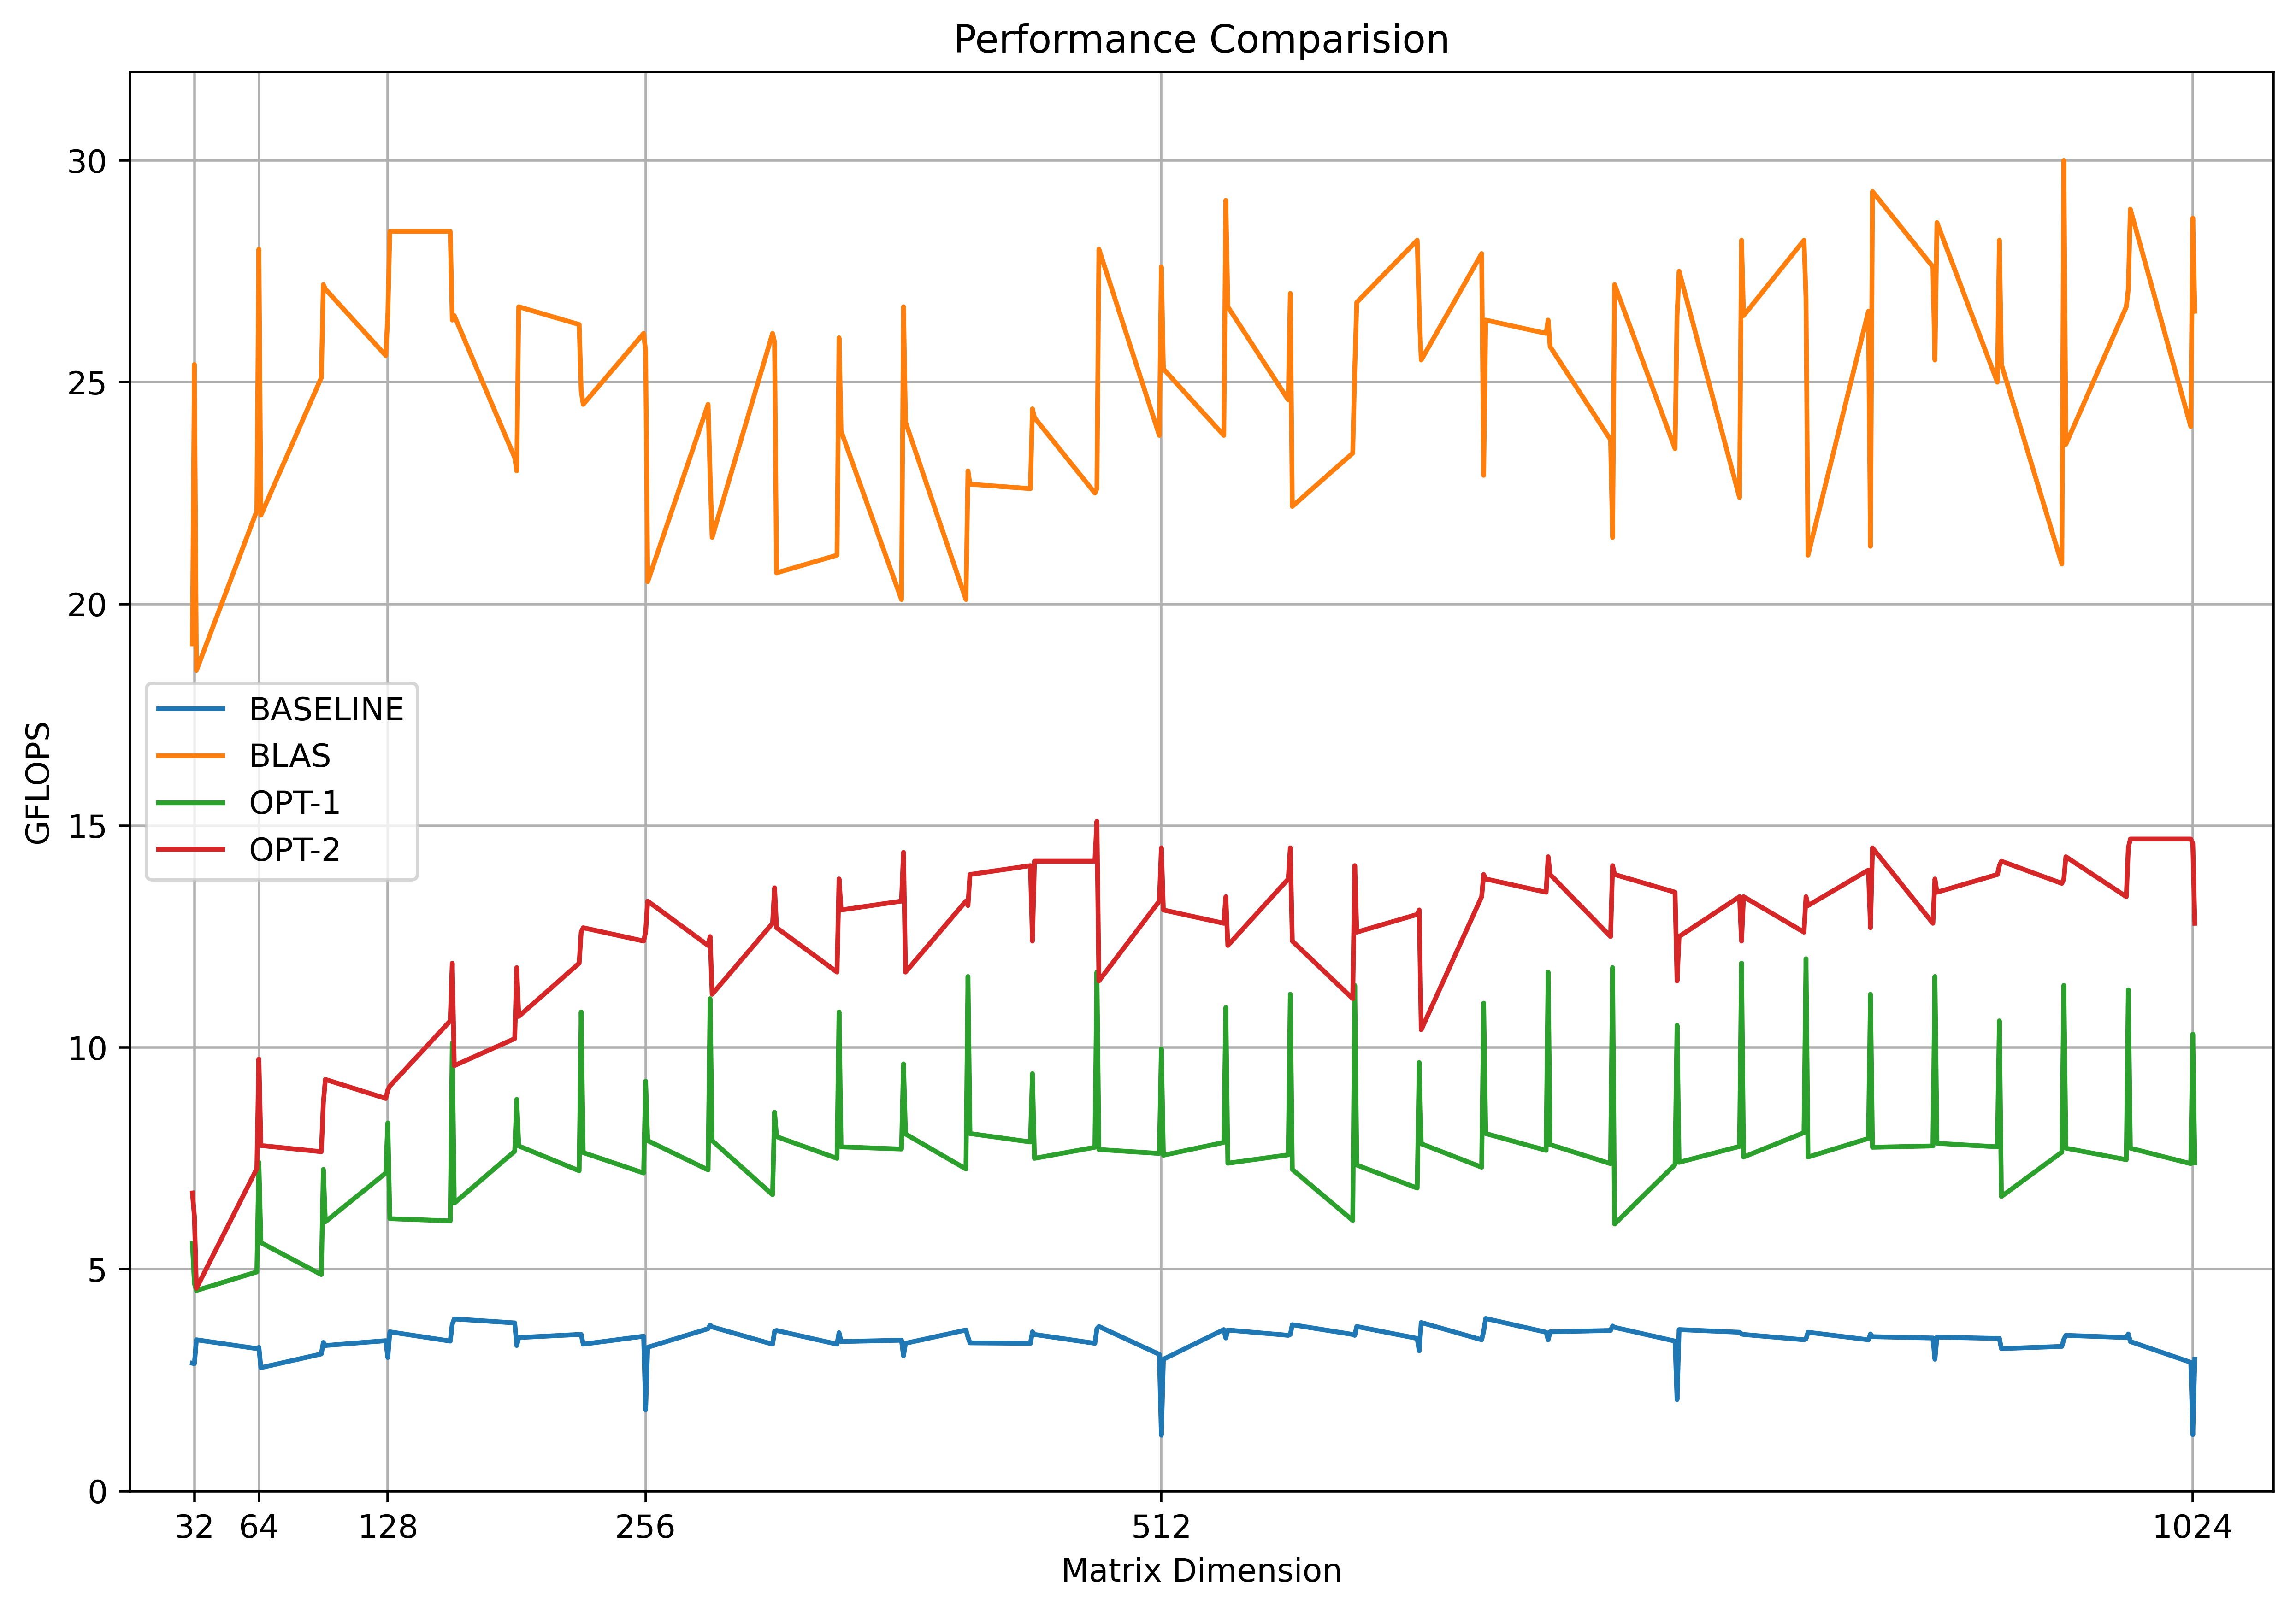 |
 |
 |
 |
 |
Install
pip install matplotlib
Usage
git clone https://github.com/XavierJiezou/python-hpc-plot.git
cd python-hpc-plot
Overwrite the dir ./data/data* and run python ./examples/main*.py to get your figure like demo fig *.
Contributors
- Code: Xuechao Z
- Data:
data1from Jiaohao T,data2from Wenxuan Z anddata3, 4, 5from Dongqiang H